CS
CS en
en 


Averna Ostrava
Technologická 374/6Ostrava-Pustkovec
708 00
STATIONARY AND PORTABLE
MEASURING INSTRUMENTS,
CENTRAL SOFTWARE
We are a long-term supplier of state-of-the-art power grid monitoring systems. Our portfolio of products and know how ranges from global phasor monitoring systems (WAMS) covering, for example, Central Europe, through metering and comprehensive evaluation of the quality of supplied electricity across the country, up to the detailed energy monitoring of industrial plants at the level of individual machine consumption. We have been developing special measuring instruments, central software and comprehensive deliveries for over 25 years, and we are at world-class level in this field with successful deliveries to almost all continents.
We can supply measurement of electricity quality from the project, through the supply and installation of devices, and central systems (also in the form of a cloud service) up to data evaluation and analysis.
TIER 1 - EM.08.0

We supply Power Quality (PQ) power analyzers (A), Phasor Measurement Unit (PMU) and Multi-Feeder-Monitor (MFM) monitoring devices.
TIER 1 - EM.08.0
ENA – SCADA enables collection of on-line and historical values from power quality analyzers, presentation of these values in various types of view, presentation and analysis of stored off-line values, monitoring system, automatic reporting and sending of results, automatic statistical data evaluation and so on.
TIER 1 - EM.08.0
The difference of phase angles of voltage at different points in the transmission grid indicates the status of the grid and thus allows earlier detection of disturbances and unwanted conditions that may lead to the grid being islanded or even to a complete blackout.
TIER 1 - EM.08.0

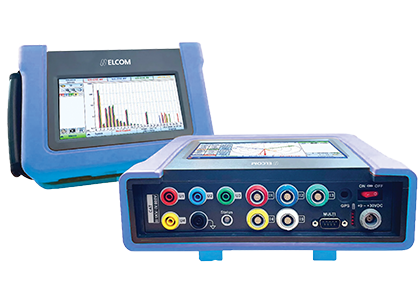
Class A Portable Power Quality Analyzer
More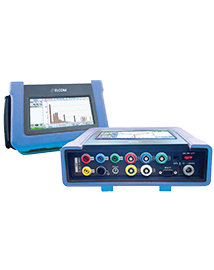
Class A Portable Power Quality Analyzer
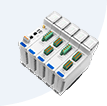
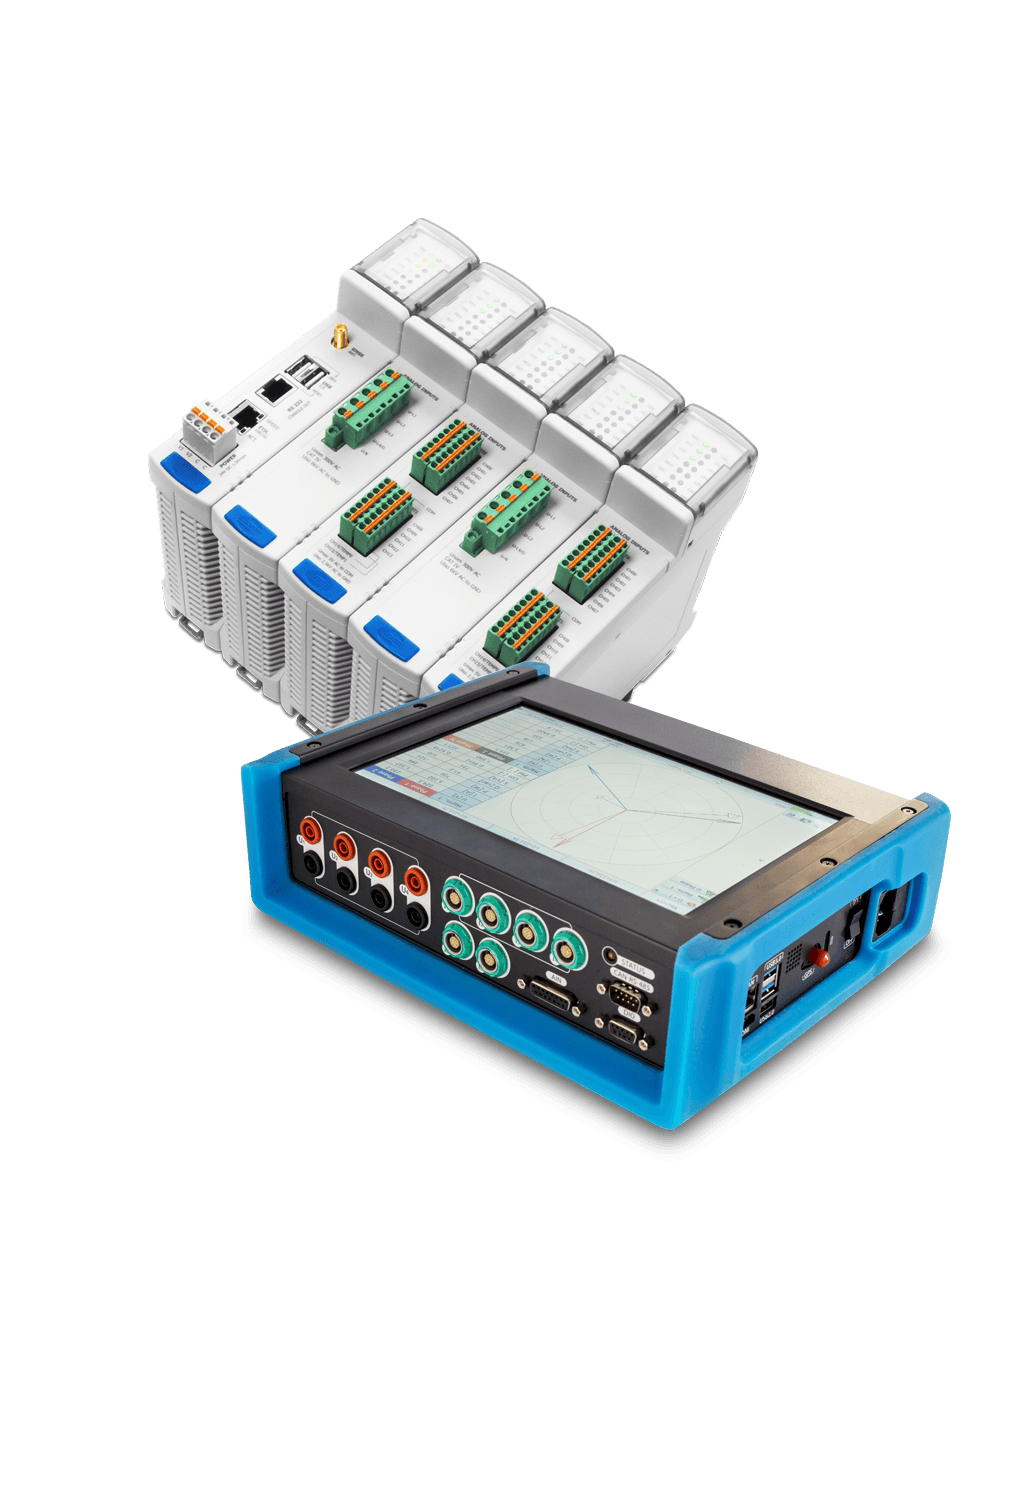
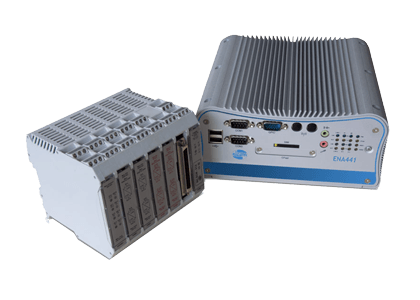
ENA-NXG is based on modular architecture, allowing combination of one CPU module and up to six selected input modules into one meter.
More
ENA-NXG is based on modular architecture, allowing combination of one CPU module and up to six selected input modules into one meter.
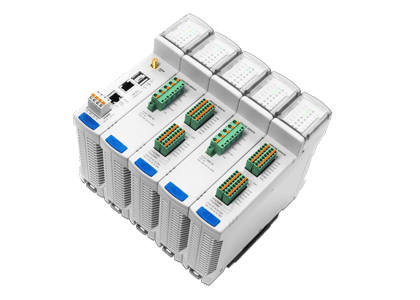
ENA-NXG is based on modular architecture, allowing combination of one CPU module and up to six selected input modules into one meter. The input modules are providing input signal isolation, filtering and A/D conversion, sending the data using digital backplane bus. The CPU module is equipped with FPGA receiving all digital input data, and the real-time controller running meter firmware and providing all interfaces and data storage.
Resulting meter functionality is based on the selected input module type and count, and on the meter firmware.

Power Quality (PQ)
The firmware calculates power quality parameters according EN50160 fully follows requirements described in IEC 61000-4-30 Class A and others (61000-4-7, 61000-4-15).
Main measurement functions are:
| CPU | |
|---|---|
| ENA‑NXG‑CPU.A | CPU module based on NI-SOM (667 MHz dual-core, FPGA, real-time OS, NI LabVIEW) with 8-32 GB SD card,Ethernet, serial port, USB for data download and direct PC connection, 24 V DC power is required |
| ENA‑NXG‑CPU.B | ENA-NXG-CPU.A extended with integrated GPS receiver |
| ENA‑NXG‑CPU.C | ENA-NXG-CPU.A extended with fiber optic interface for ENA-TIR (ENA-TIR is external GPS receiver) |
| All analog input modules are providing 24 bit sigma-delta A/D conversion | |
|---|---|
| ENA‑NXG‑HVI.A | 4 channel high voltage input module, 300 V RMS range (measuring up to 600 V RMS), 6 kV isolation. Used for direct voltage measurement |
| ENA‑NXG‑LVI.A | 16 channel low voltage input module, 1 V RMS range 2 channels can be switched to temperature measurement/PT1000. Used for indirect current measurement (XX Amp / 0.33 V CTs) |
| ENA‑NXG‑LVI.B | 8 channel low voltage input module, 1 V RMS range Used for indirect current measurement (XX Amp / 0.33 V CTs) |
| ENA‑NXG‑HCI.A | 4 channel current input module, 1 A RMS range Used for indirect current measurement (XX Amp / 1 A CTs) |
| ENA‑NXG‑HCI.B | 4 channel current input module, 5 A RMS range Used for indirect current measurement (XX Amp / 5 A CTs) |
| ENA‑NXG‑DIO | 8 digital inputs, 4 digital outputs |
PMU – Phasor Measurement Unit is a device for accurate synchrophasor measurements using GPS.
The PMU firmware measures voltage and current phasors (with a Total Vector Error less than 0.5 %), frequency, calculates the positive symmetrical components of voltages and currents. It can apply measuring transformers error correction. The measured data is sent to the superior system according to the IEEE C37.118-2005 communication protocol. The measurement results are used for on-line detection of electrical grid status based on comparing the phase angle of the funda-mental harmonic measured at different points of the distribution or transmission network using several devices in synchronized points in time.
Meter input modules can be combined in a way of measuring one 3-phase voltage and multiple 3-phase current systems. The intention of such meter is typically to monitor the distribution transformer powering multiple output feeders.
Functionality of multi-feeder-monitor is similar to PQ meter, with possibility to measure up to 10 3-phase feeders in total. Multi feeder monitor also provides detailed information about power and energy consumption of each feeder.
The ENA-NXG is flexible hardware and software platform. It allows mix of different input modules count and type, allowing to build device following end user needs. Also the firmware functionality can be prepared as a mix of above mentioned functions, and additional user requirements can be applied into the firmware.
In special cases ENA-NXG platform can be provided as open OEM system with set of development examples for customer’s own development.
Class A Portable Power Quality Analyzer
More
Class A Portable Power Quality Analyzer

Class A Power Quality Analyzer Up To Four 3-Phase Systems
More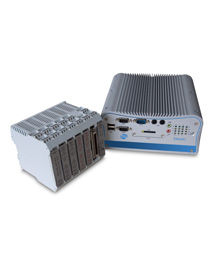
Class A Power Quality Analyzer Up To Four 3-Phase Systems
Simple setup and control tool for ENA-NXG
More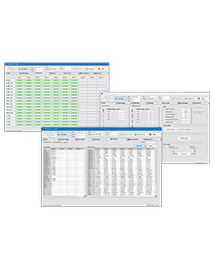
Simple setup and control tool for ENA-NXG
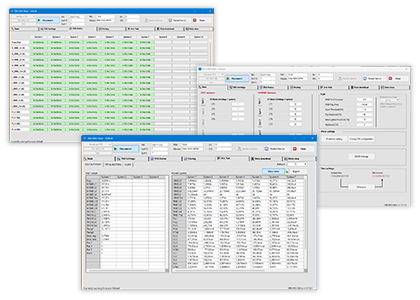
ENA-SCADA is distributed system for Power Quality analyzers (PQ). Software can communicate with hundreds of meters, and can support also third party PQ meters.
More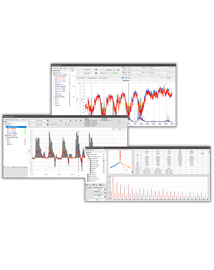
ENA-SCADA is distributed system for Power Quality analyzers (PQ). Software can communicate with hundreds of meters, and can support also third party PQ meters.

ENA-SCADA is distributed system for Power Quality analyzers (PQ). Software can communicate with hundreds of meters, and can support also third party PQ meters.
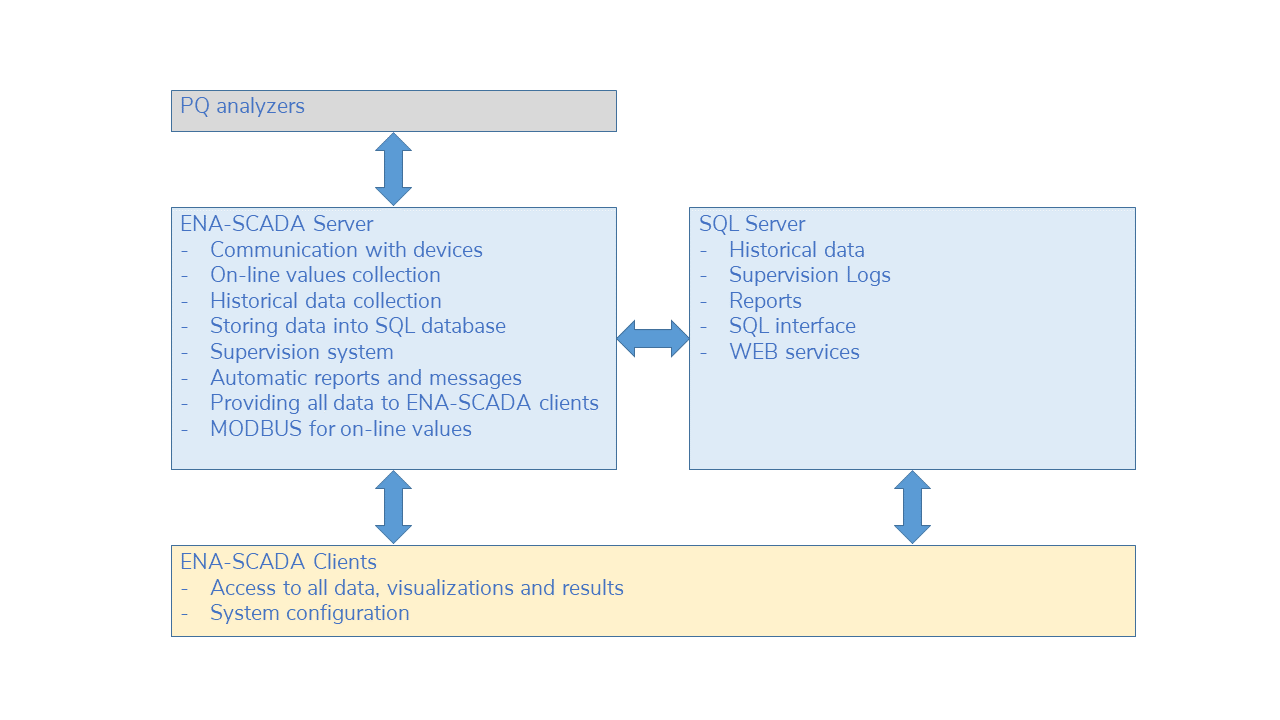
Automatic reading of real-time and historical data
Communication using device specific protocols and formats.
Storage of all historical data into SQL database
All historical data, protocols, supervision records etc. Are stored in the SQL database. Data is not encrypted, and it is also available to other users with sufficient user rights.
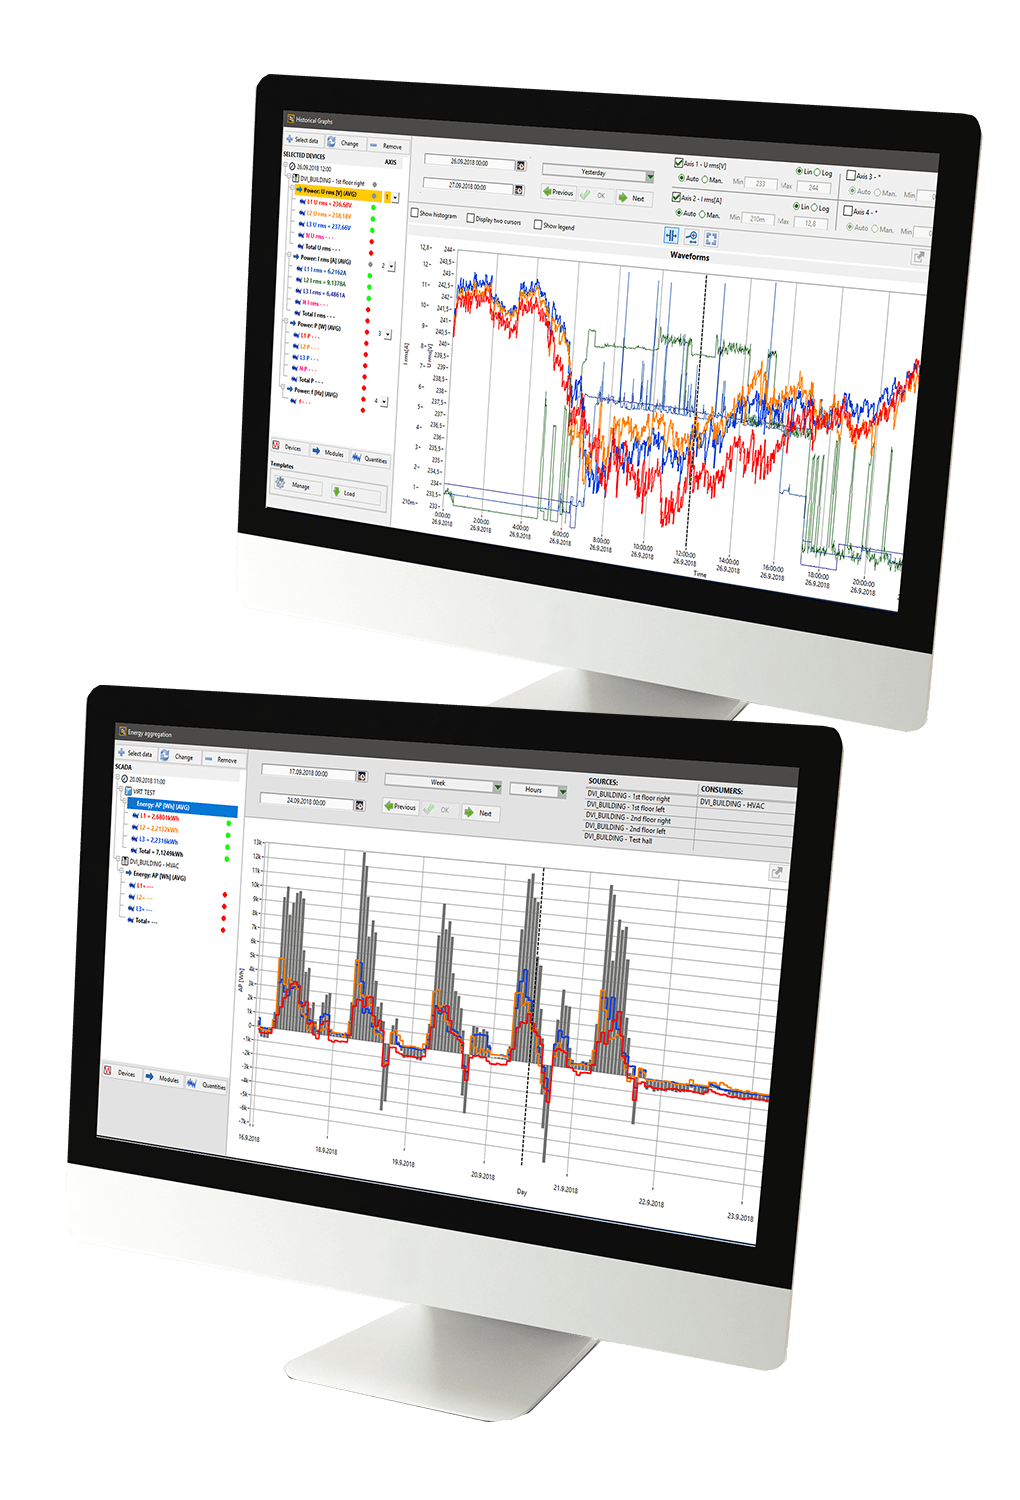
On-line data
Actually measured quantities are displayed in the table, graph, as V/f profile, vector spectra or on the map.
User is able to view last disturbance or transient including waveform for each measurement system.
It is possible to display values for each phase, and total values also.
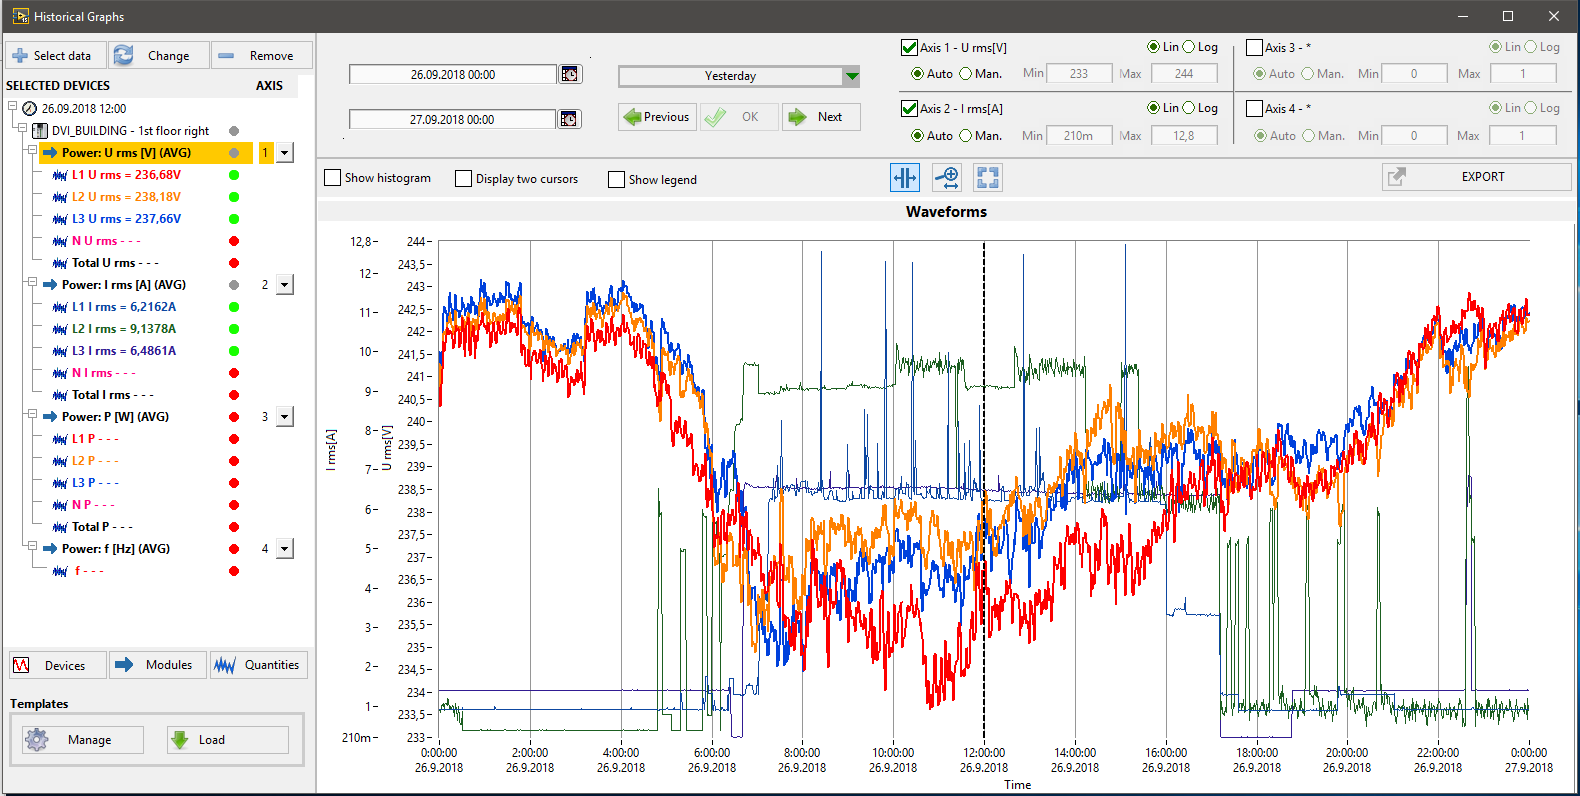
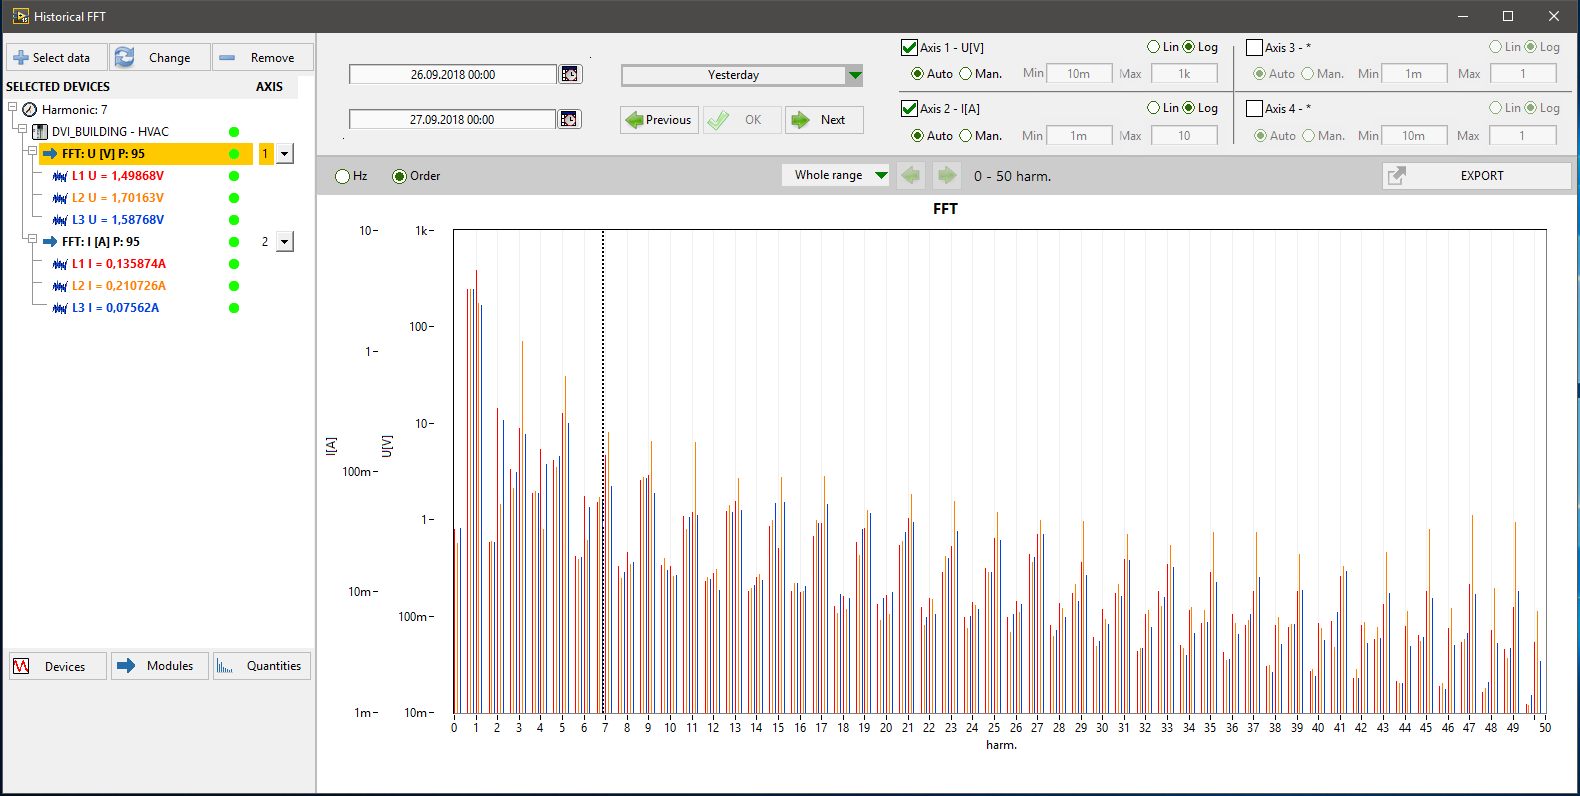
Historical data
Archived data are displayed in the graphs, as historical FFT (Spectral display), EN50160 evaluation, energy (hourly/daily), events list, events statistics, reports list.
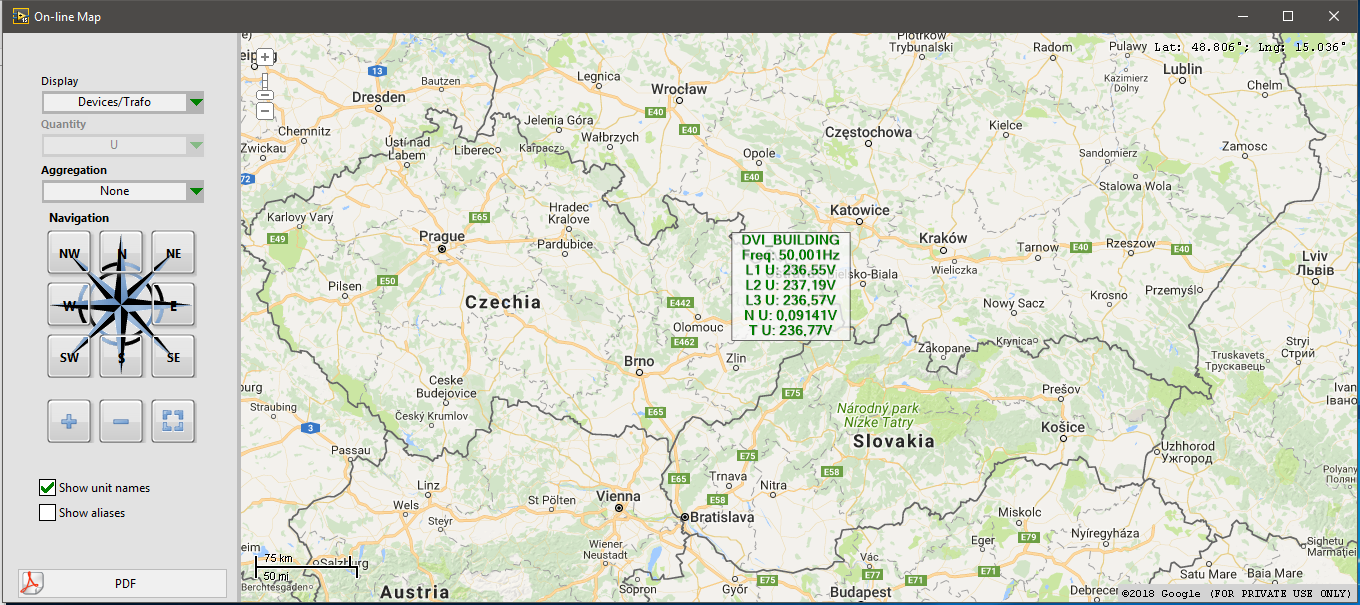
Geographical visualization
ENA-SCADA provides basic information about actually measured voltage and frequency in the geographical view. User can view all substations/areas where analyzer(s) are installed. Each substation/area shows actual state based on actual voltage level (under/over voltage etc.). Supervision map indicates possible device fault condition.
Reports
User is able to easily export every viewed panel to PDF protocol including basic measurement information. Automatic reports are also available to be configured for events (disturbances and transients).
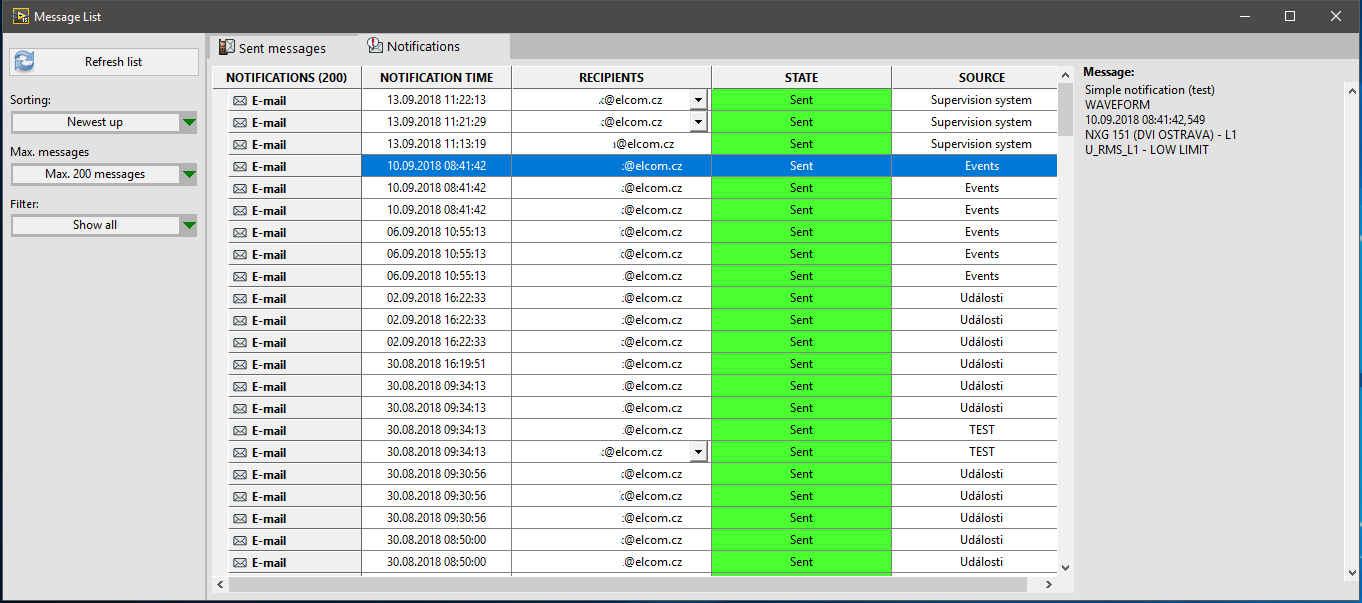
Notifications
System is able to send notifications automatically and to add a report (if available) under certain circumstances. Sending may be triggered by the event on a device (Voltage Event, Transient record detected) or by the supervision event.
Supervision
The powerful supervisory management monitors each device status and its fault state. Supervision overview distinguishes between two states: OK and Failed. Available function for monitoring are: ping, sw running, data storing, data in the database.
Providing data to other systems
System ENA-SCADA can communicate with other systems, and also can provide its own data to any third party systems – web-service, SQL, MODBUS/TCP.
EN50160 Evaluation
The EN50160 Evaluation contains a table with statistical evaluation of all required measurements according to EN50160 standard for selected time period (months or weeks).
Hierarchical tree view of all meters (substation, area etc.)
User can search for a specific device either by expanding the tree structure to the desired level, or simply find device using the Device Search Box.
Virtual Energy Meter
Virtual energy meter is a special type of instrument in an application that consists only of a list of positive and negative real meters.
Its historical data (energy) can be viewed in the same way as from real devices, the server automatically calculates the sum of positive and negative components.
Usage – if the input and all outputs of the local network are monitored, the total balance (losses) can be displayed.
Events (PQ, Waveforms)
Automatically generated events list captured by meter itself or captured by Master Station (custom events): Alarm, Voltage harmonic alarm, Voltage alarm, Transient, Disturbance, EN50160 event, Custom event. It is possible to show last transient for each system. Displayed are two 200ms waveforms. It is able to show last disturbance for each system. Displayed are 60 seconds of half-period voltage and frequency waveforms including 5 seconds pre-trigger. Auto-print the newest disturbance.
Events (Supervision)
SCADA uses „ping“ command and awaits echo reply to determine whether the analyzer is accessible or not. System also checks, if software on the ENA analyzer is running, if data storing is enabled, if data from analyzer was copied to the database (including „database full“ detection).
Vizualization – Actual Values
Tables
Graphs – Last 1 minute, 10 minutes, 1 hour
Last Waveform/Disturbance
Vector Diagram & Harmonic Analysis
Maps
Supervision – Quick Overview
Vizualization – Historical Data
Graphs
FFT Analysis
Histograms
Energy Profile
EN50160 Evaluation
Events (PQ, Waveforms)
Events (Supervision)
Vizualization – Configuration
Devices
Users
Substations/Areas
Protocols
Notifications
Supervision